Data Visualisation
Data Visualisation
Overview
I have created several dashboards for different use cases below for users to process a lot of data in a short period of time.
What was designed:
Wireframes, Dashboard designs
Role:
User interface designer
Year:
2019
Asmet Dashboard
A new dashboard design to be used at reed for the devs to have an overview of all the performance speeds and scores for site.

Insights

Lighthouse

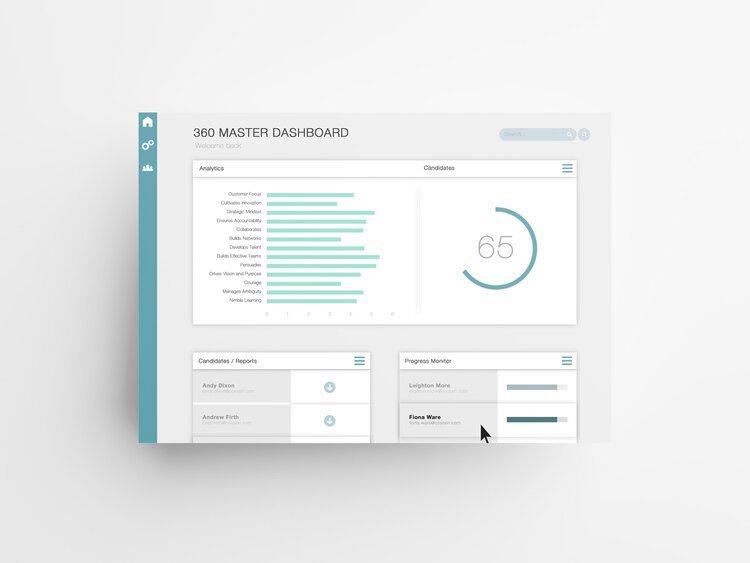
360 Master Dashboard
At APS I had to design a dashboard for recruiters to analyse the data based off the reports they have completed.


Report Designs
At APS customers would be receive feedback in reports so data visualisation graphics needed to be used and easy to understand.